|
|
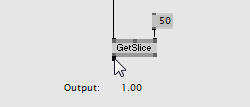
A pin holding a single value
Hovering a pin with the mouse displays the pins name and its current value.
|
|
|
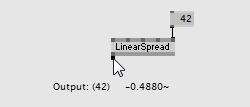
A pin holding a spread of values
If a pin holds a spread the tooltip also shows a number in round brackets that tells you its Slice Count.
Note: A tooltip will always show only the first slice. If you want to explore other slices open an Inspektor.
|
|
|
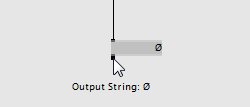
A pin holding an empty spread
More about empty spreads (aka nil).
|
|
|
First slice of all pins
The Inspector by default shows only the first slice of a pin.
|
|
|
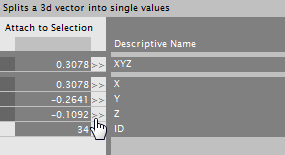
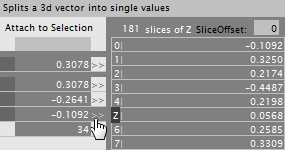
All slices of one pin
If you want to see all slices of a pin, click on the double arrow >> icon in the middle of the Inspector. This brings up a new view that shows all the slices of the selected pin.
Click the >> icon again to hide this view.
|
|
|
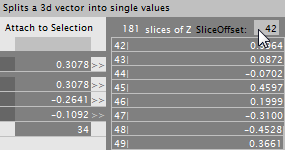
Scroll through
Changing the Slice Offset allows you to scroll through a long list of slices.
|
|
|
Editing Slices and Slice Count
Note: If pins slices appear dark it means that they cannot be edited. This is true for output pins or input pins that are connected.
Individual slice values can be changed and setting the Slice Count sets the the number of slices in this spread.
|
|
|
By default an IOBox shows only one slice.
Using the Inspektor you can configure an IOBox to show multiple slices. First scale the IOBox to size, then have a look at its configuration pins in the Inspektor.
|
|
|
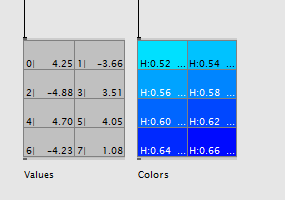
Viewing multiple slices
An IOBox that has its input connected is used for displaying data. In this case we use the Columns and Rows to create a grid of slices that suits our needs to display all or only a subset of the incoming slices. If the spread is too big to be viewed at once use the Slice Offset to scroll through the spread. Also consider enabling Show SliceIndex in order to display the slices index number in each slice-cell.
|
|
|
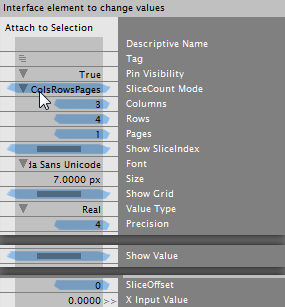
Editing multiple slices
An IOBox that has its output connected is used for entering data. In order to create a spread from scratch in the IOBox first set its SliceCount Mode to ColsRowsPages. Then you can use the Columns and Rows to create a grid of slices. Each of these slices can now be edited.
|