This site relies heavily on Javascript. You should enable it if you want the full experience. Learn more.
Debug DX11 Frames with Nvidia Nsight
UPDATE: There is also a similar tool that is open source, see this blog post: debug-dx11-frames-with-renderdoc
Just a quick one found today and everyone should know about. Nvidia Nsight Graphics works just fine with vvvv and dx11. This can help to profile your graphics performance and find bottlenecks.
The steps are pretty simple:
- Download and install: https://developer.nvidia.com/nsight-graphics
- Start the application, click "Quick Launch" and you should see this screen:
- Add your vvvv.exe and press "Launch"
- Load any patch/scene with dx11 and you should see some Nvidia HUD in the renderer
- Press CTRL+Z and then SPACE to capture the latest frame and bring up Nsight
- Now you can inspect your frame like this:

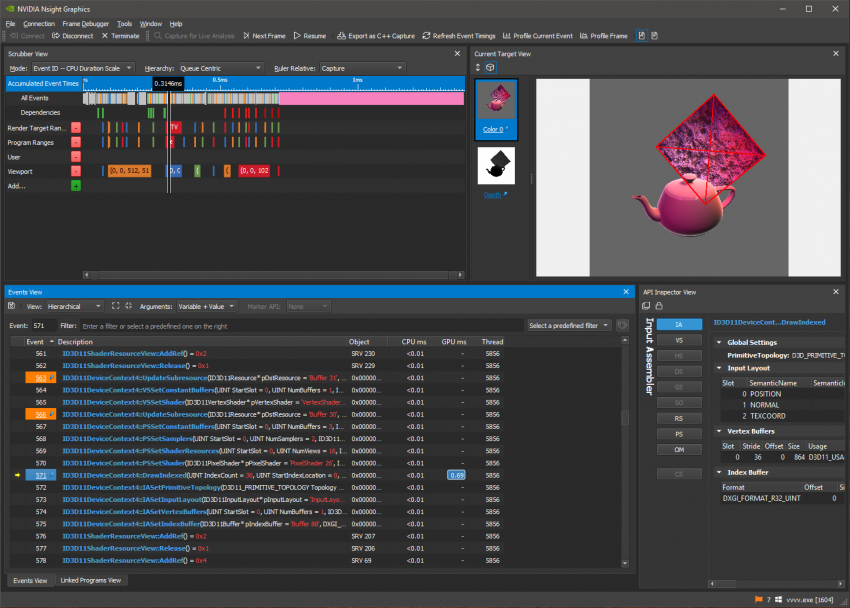
- Or have more details, timeline, API calls, timings etc. in the Nsight application:
That's it, just so you know.
Yours, devvvvs
- 1
anonymous user login
Shoutbox
~4d ago
joreg:
vvvvTv S02E01 is out: Buttons & Sliders with Dear ImGui: https://www.youtube.com/live/PuuTilbqd9w
~10d ago
joreg:
vvvvTv S02E00 is out: Sensors & Servos with Arduino: https://visualprogramming.net/blog/2024/vvvvtv-is-back-with-season-2/
~10d ago
joreg:
@fleg https://rustdesk.com/
~11d ago
fleg:
hey there! What's the best tool for remote work? Teamviewer feels terrible. Thanks!
~24d ago
joreg:
Last call: 6-session vvvv beginner course starting November 4: https://thenodeinstitute.org/courses/ws24-5-vvvv-beginners-part-i/
~1mth ago
joreg:
Missed the last meetup? You can rewatch it here: https://www.youtube.com/live/MdvTa58uxB0?si=Fwi-9hHoCmo794Ag
~1mth ago
theurbankind:
When is the next big event, like node festival ?
~1mth ago
joreg:
Introducing: Support for RPLidar devices by Slamtec: https://visualprogramming.net/blog/2024/introducing-support-for-rplidar-devices-by-slamtec/
~1mth ago
joreg:
Join us for the next vvvv meetup on Oktober 17th: https://visualprogramming.net/blog/2024/25.-vvvv-worldwide-meetup/
~2mth ago
joreg:
6 session beginner course part 2 "Deep Dive" starts January 13th: https://thenodeinstitute.org/courses/ws24-5-vvvv-beginners-part-ii/


oh nice! same goes for renderdoc. And I also like to point out dotTrace and dotMemory by Jetbrains. with dotMemory you can have a look which object takes up how much space in ram. We're currently using that to hunt down a memoryleak. And with dotTrace you can have a look at how long methods are executing and a timeline about what each thread created from vvvv are doing ;)
unfortunately though they're not free
And for general application profiling of .Net/Windows: PerfView (Perfview on Github)
@microdee and @beyon thanks for the (open source) additions! didn't know about them except the jetBrains stuff.
super useful post, thank you !
Just came across another free .Net profiler: CodeTrack
Have just had a quick look at the web site though so don't know how it compares with the others.
@beyon that looks quite nice also. i'll try that one as well in our latest project.